A Cross-Platform, Web-Based Information Visualisation
Framework using JavaScript and WebGL.
Description
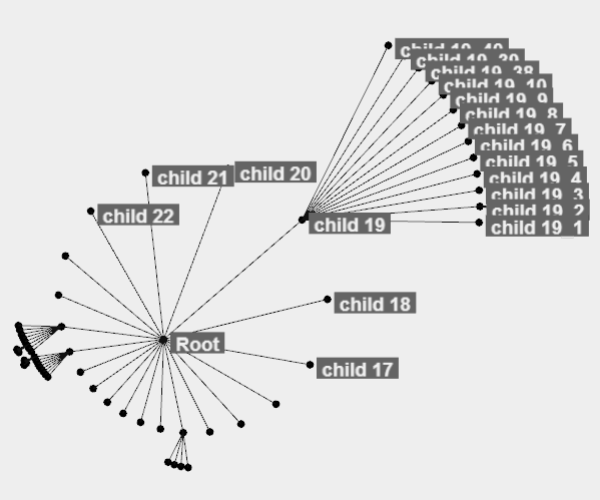
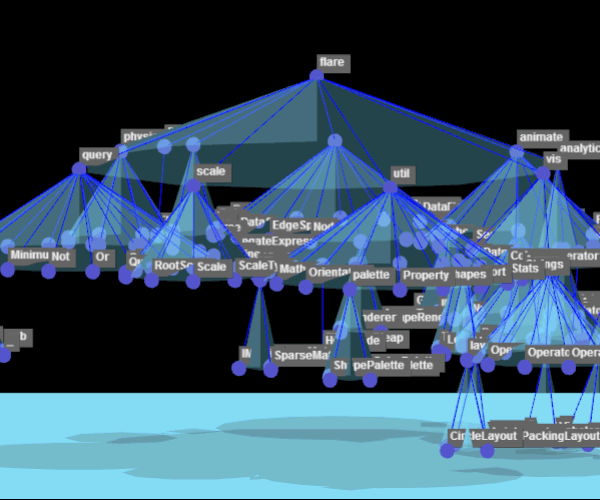
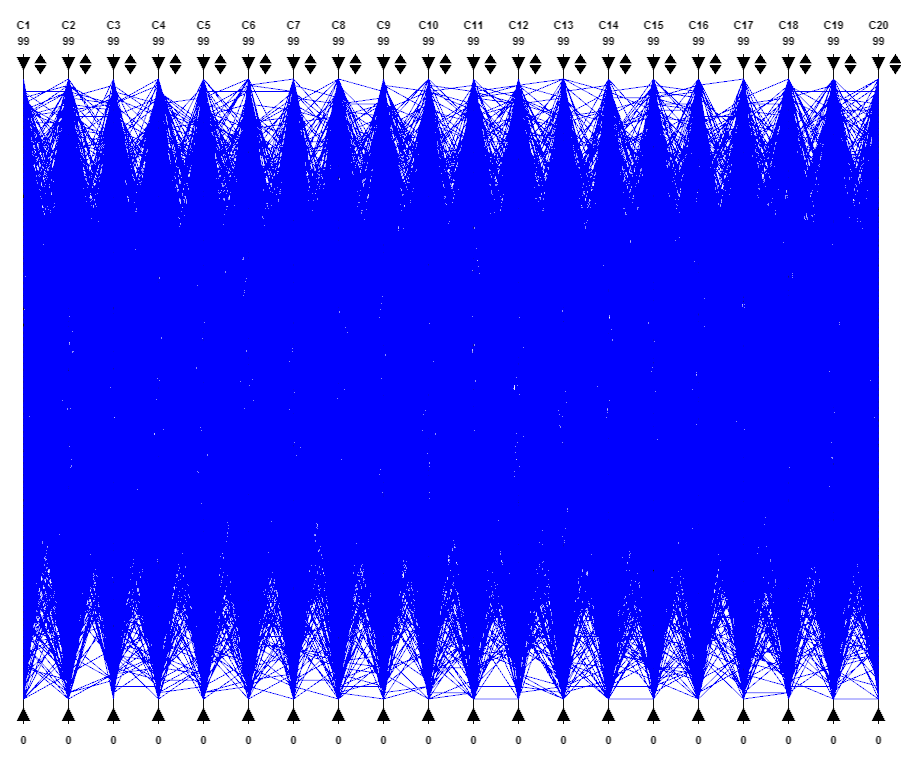
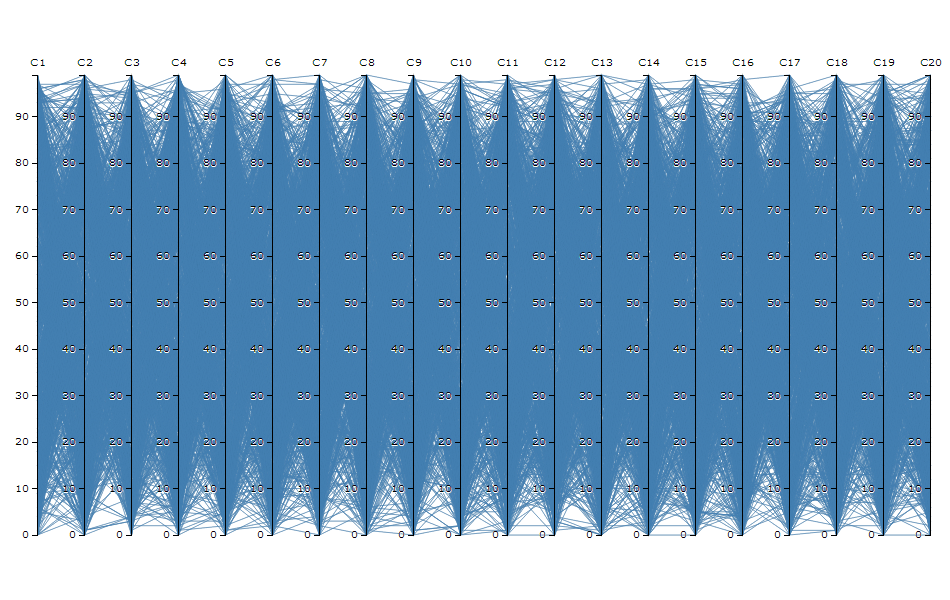
FluidDiagrams is a cross-platform, web-based information visualisation
framework using JavaScript and WebGL.
Download
FluidDiagrams version 0.9 can be downloaded as a zip file
here.
Publications
[And2014]
Keith Andrews and Benedict Wright;
FluidDiagrams:Web-Based Information Visualisation using
JavaScript and WebGL;
Proc. Eurographics Conference on Visualization (EuroVis 2014),
Swansea, UK.
doi:10.2312/eurovisshort.20141155
(PDF)
[Wri2014]
Benedict Wright;
FluidDiagrams: A Cross-Platform, Web-Based Information Visualisation
Framework using JavaScript and WebGL;
Master's Thesis, Graz University of Technology,
Austria, 24 Jan 2014.
(PDF)